联系我们
Big Data Analytics of Semiconductors
Combine insights dashboard and in-depth analysis system

How to extract the value from big data?

In the current era of semiconductor manufacturing processes, data-intensive adjustments are becoming increasingly important. In addition to technical adjustments to improve yields, it is especially critical to analyze data through the end-to-end whole industry chain.
Unified Data Management
Fast access and integration of massive data from all sources
Accelerate product development and improve yield rate
Effective management of supply chain
Efficient Analysis Platform
Provide efficient, targeted analysis capabilities
Effectively help companies improve yield and product performance
Data Visualization
Simple software that offers extended functionality
Quickly update data
Quickly analyze and create visual charts
DataExp data analysis platform: a balance between fast browsing and in-depth analysis
  • Unified data management

Support test data, process parameters, wafer defect data and images, etc.

Import and unified management of multiple types of data

  • Data Dashboard Configuration

Rich out-of-the-box data dashboards are available to meet the needs of IC

The field of data analysis meets the needs of daily viewing and monitoring data.

  • Visualization and High Interaction

The platform's visualized, highly interactive application front-end is convenient for diverse and flexible data analysis

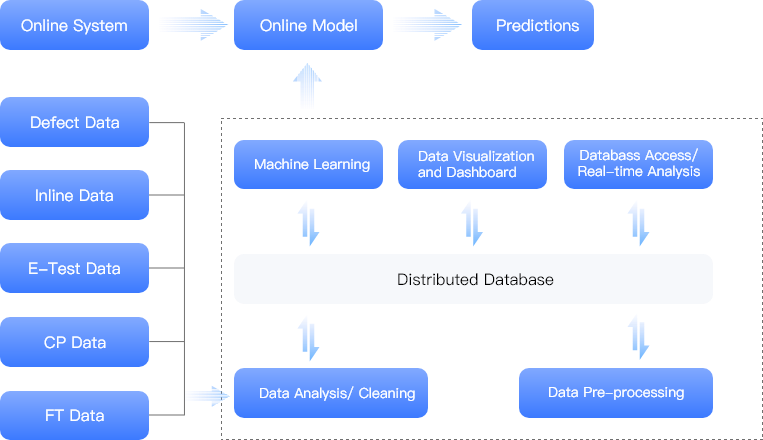
  • Distributed Data Management

The underlying data architecture uses the latest distributed database and management system to guarantee effective and fast access/data integration with flexible scalability

Easy to derive other applications on top of the platform

undefined

DataExp Data Analytics Platform

  • DataExp platform for Fab, Fabless, IDM & OSAT

Background data collection, streaming, cleaning, analysis through modeling engine.

  • Yield data analysis

Based on DataExp's powerful mapping function and automatic generation of analysis reports, users can quickly analyze data and complete the visualization process to automatically generate analysis reports for WAT or In-line data.

  • RF data analysis

For RF data, customers can import a library of device parameter files and perform operations such as batch conversion of parameters, de-embedding,mode and phase extraction taking mode, taking phase, etc., and plotting curves of parameters such as Smith Chart, amplitude frequency, phase frequency, etc.

Learn more about products
Click to enter
XML 地图